I would be extremely interested to see the results as I know how useful this information has been to the other schools in the
borough
20 years of #children and young people's fitness. #healthed #physed
|
SHEU : nationally-recognised, since 1977, as the specialist provider of reliable local survey data for schools and colleges |
Young people’s assessment of their fitness
Since 1991, the Schools Health Education Unit have asked over 477,000 young people about their fitness. The question appears in the Health Related Behaviour Questonnaire (HRBQ) among other questions relating to exercise and sport. The results, from over 100 questions in the HRBQ, are used by health and education authorities to inform their planning.
The young people are asked to rate their level of fitness on a scale: Very fit, Fit, Moderately fit, Unfit, Very unfit. The chart below show data compiled from 477,549 10-15 year olds.
10-15 yr. olds who report being fit or very fit, 1991-2011
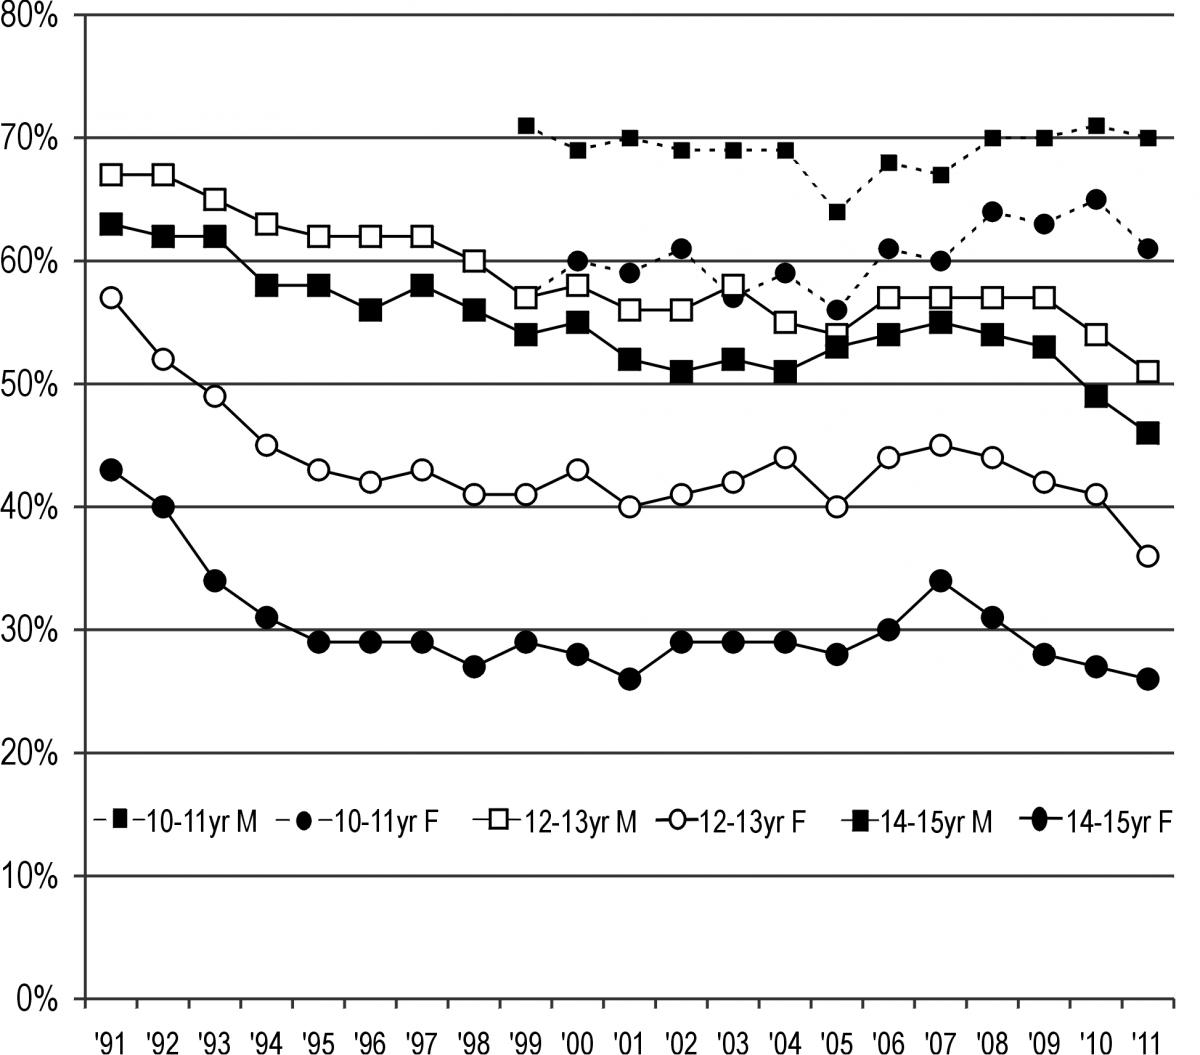
There is an overall decline in those reporting being fit or very fit. As they get older, the females report feeling they have lower fitness levels. 14-15 year old females have consistently reported the lowest levels of fitness. The higher self-assessment of the males is consistent with their higher participation in sporting activities. Do the females see themselves as less fit than the males because they participate in less physical activity or indeed are they less fit than the males?
For details about the SHEU HRBQ please visit this link
For the young people's page visit this link
See also -
There are many research studies into young people and fitness including:
Young people are fit and active - fact or fiction? " ... young people’s habitual physical activity and aerobic fitness ... reference to previous generations."
Children are still fit, but not active! "... young people's fitness and physical activity are not deteriorating over time."
Childhood aerobic fitness predicts cognitive performance one year later "... children classified as aerobically fit still outperform their lower-fit peers on the cognitive challenge approximately one year later."